How many sandboxed pods can fit in a Pi?
The rationale of edge computing is simple: instead of moving data to centralized data centers, computation is brought closer to where data is produced. In practice, this means deploying software on hardware that lives in factory floors, retail stores, cell towers, and remote infrastructure.
However, these systems are no longer single-purpose. Modern edge nodes host multiple workloads from different sources: a computer vision model from one vendor, a telemetry pipeline from another, a customer-facing microservice maintained by a third team, etc. On top of that, the AI wave introduces new risks: code with subtle vulnerabilities, supply chain attacks, and AI-driven exploitation techniques.
As a result, even systems that appear single-tenant behave in practice like multi-tenant environments. Workloads with different trust assumptions coexist on the same node, making isolation a baseline requirement rather than an optional feature.
At the same time, edge devices operate under strict resource constraints, typically limited to single-digit GBs of RAM and few CPU cores, where every megabyte consumed by isolation mechanisms directly reduces capacity for actual workloads. Traditional cloud-centric assumptions about isolation overhead collapse in this environment; a technique adding 100MB per pod might be acceptable in a data center but becomes prohibitive when the entire node has only 8GB available.
This raises a practical question that cloud-based benchmarks cannot answer: how do sandbox runtimes perform on resource-constrained edge hardware? What is the real cost of strong isolation when resources are limited?
In this post, we answer this question empirically. We evaluate multiple sandbox runtimes on a humble Raspberry Pi 5, measuring the impact on startup latency, scalability, and resource efficiency.

Figure 1: Edge nodes resemble clown cars: many sandboxed workloads squeezing into limited resources.
The container runtimes under evaluation
In this small experiment, we evaluate four different container runtimes: a) runc, b) gVisor, c) Kata Containers and d) urunc.
runc: the standard container runtime
A typical container is just a Linux process running in a different “view” of the host environment. The mechanisms that facilitate this separation are Linux kernel features, such as namespaces, cgroups access control mechanisms, etc. While this approach can be as lightweight as a normal Linux process, it has the drawback of sharing the same host kernel. Therefore, a container escape can have extremely unpleasant results, such as compromising the entire node, other containers and many more.
gVisor: a userspace kernel as an intermediate layer
In an effort to reduce the exposure of the host kernel to the containers, gVisor intercepts all system calls performed by the container and tries to handle as many system calls as possible in a userspace kernel. The ones that cannot be handled, for instance I/O, are redirected to the host kernel.
This model reduces the exposure of the host kernel to the containerized workload, but it adds extra overhead due to the userspace kernel, and the additional components result in extra resource utilization.
Kata Containers: containers inside microVMs
Kata Containers go even further than gVisor and execute a microVM inside which the container will execute. Kata Containers integrate the lifecycle management of the microVM with the container and hence reduce the burden from the user. The use of Virtual Machines has been the gold standard for isolation in the same host. A workload running inside a VM does not interact at all with the host kernel. Instead, a guest kernel serves all system calls and interacts with a VMM for I/O.
However, Kata Containers execute a microVM, which, even if much smaller than traditional VMs, it still consumes a lot of resources and adds extra overhead. Furthermore, Kata Containers require specific features from the guest kernel and an agent running inside the microVM to manage the containers inside it.
urunc: the container runtime for unikernels and single application kernels
Unikernels are single address space machine images specialized for a single application. They sound like a good fit for resource constrained environments, since they add little overhead and require fewer resources. However, deploying unikernels was not straightforward; until the introduction of urunc, a container runtime which is able to manage unikernels as typical containers. Apart from unikernels, urunc also supports single application kernels, which are just applications running on top of a generic kernel, like Linux or BSDs. However, urunc does not have any requirement from the kernel and does not require any component running inside the guest. Therefore, the kernel can be extremely small and inside the VM running one and only one application.
Yet, the extra layers of the VMM or software-based sandbox add extra overhead and require additional resources. Or maybe not.

Let’s find out!
Experimental setup
All experiments were conducted on a Raspberry Pi 5 8GB RAM, running a single-node K3s cluster, with flannel as CNI. The RPi5 hosts both the Kubernetes control plane and the workloads. Since we only want to measure the overhead the container runtime adds, we use a simple HTTP server, which just responds to GET requests with 200 OK.
The server is written in C and built statically, creating a single binary container image able to execute on top of runc, gVisor and Kata. For the urunc Linux guest equivalent, the image also contains a minimal Linux kernel and the application is placed inside initrd. The same C HTTP application is also built as a unikernel over Unikraft and Rumprun while for MirageOS we create an equivalent OCaml version of the HTTP server.

Container runtime versions and configuration
The versions used for each container runtime are the following ones:
- K3s: v1.35.4+k3s1 (5dc8fe68)
- runc: 1.1.5+ds1-1+deb12u1
- gVisor: release-20260223.0
- Kata-QEMU: 3.19.1, commit: acae4480ac84701d7354e679714cc9d084b37f44
- Kata-Firecracker: 3.28.0, commit: fa6a26c04d6153db6861b20556756294c373f1e4
- urunc: 0.7.0-f5e67fb
NOTE: In Kata Containers, we experienced frequent pod restarts when using Firecracker in v3.19.1. We therefore updated to v3.28.0 (the Rust-based runtime), which was more stable with Firecracker. However, this newer version was unstable with QEMU, so we used v3.19.1 for QEMU and v3.28.0 for Firecracker.
For urunc the monitors under evaluation had the following versions:
- QEMU: 10.2.1 (kata-static)
- Firecracker: v1.7.0
- Solo5-hvt: version v0.9.0
- Solo5-spt: version v0.9.0
In all container runtimes the snapshotter in use was overlayfs except for Kata Firecracker version which required a block-based snapshotter (used devmapper).
The configuration of the runtimes was the default one, except for the following changes:
- In gVisor, we set KVM as the platform
- In Kata QEMU, we set
default_memoryas 256, 1 inmemory_slotsand 256 as thedefault_maxmemory. Still, Kata was assigning the following memory in the VM-m 256M,slots=1,maxmem=1280M. We were unable to have a working Kata Qemu version with less memory. - In Kata Firecracker, we set
default_memoryas 128, 10 inmemory_slotsand 128 as thedefault_maxmemory. We were unable to have a working Kata Firecracker version with less memory. - In urunc, we set the default memory for each monitor as 16 MiB. Therefore, unless overridden by the pod deployment resource configuration, the sandbox will be allocated 16 MiB of memory.
NOTE: All configurations are available in the repository.
Methodology
The experiment setup is straightforward. We deploy the same application across all container runtimes while varying the number of replicas.
A Python benchmarking script polls the Kubernetes API to track pod state transitions (Running and Ready conditions) and in the same loop, it also polls the Blackbox service to get the HTTP availability of the pods. By combining these two sources, we were able to compare:
- When pods were reported as Ready and Running by K3s
- When they actually responded successfully to HTTP requests
All timings are measured relative to deployment start and recorded every 0.5 seconds. This means the timelines show overall trends and differences between runtimes, not exact sub-second timings. Each timestamp reflects when an event was first observed within that 0.5-second window.
For readiness, the script polls the Kubernetes API and counts pods that are
Running and Ready=True. For HTTP availability, we use blackbox probe results
grouped in the same intervals. Kubernetes readiness reflects the system’s
internal state, while blackbox probing reflects externally observable service
availability. These are related, but not identical.
Evaluation and Results
1. Pod capacity (scalability)
In this experiment, we measure the maximum number of pods that can be deployed concurrently for each runtime.
For each configuration, we gradually increased the number of replicas until the system could no longer schedule additional pods reliably. In practice, this limit is determined by memory consumption and runtime overhead on the Raspberry Pi.
| Runtime | Variant | Max Pods Supported | Pods Used |
|---|---|---|---|
| runc | - | 487* | 100 |
| kata | qemu | 21 | 21 |
| kata | fc | 65 | 65 |
| gVisor | - | 176 | 100 |
| urunc | unikraft/qemu | 265* | 100 |
| urunc | linux/qemu | 165 | 100 |
| urunc | linux/fc | 210 | 100 |
| urunc | rumprun/spt | 430* | 100 |
| urunc | rumprun/hvt | 380* | 100 |
| urunc | mirage/spt | 330* | 100 |
| urunc | mirage/hvt | 330* | 100 |
* We are able to deploy even more pods if we further decrease the memory to less than 16 MiB.

The overhead breakdown explains the density differences. Since Kata Containers require at least 256MiB and 128MiB of memory for QEMU and Firecracker VMs respectively, they incur the highest per-pod cost, with Kata QEMU reaching 23.2x the overhead of runc. while Kata Firecracker is lighter at 7.5x overhead. gVisor lands at 2.8x, but its userspace kernel and I/O proxy still add up. The urunc unikernel variants tell a different story: rumprun/spt sits at just 1.1x overhead (430 pods), and even MirageOS and Unikraft stay between 1.5-1.8x. Even with Linux as a guest kernel and with no in-VM components, urunc manages to outperform gVisor using Firecracker as a VMM 2.3x and stay quite close with QEMU as a VMM, while still providing a dedicated kernel per pod.
runc serves as the baseline, achieving the highest pod density, capable of executing more than 487 pods. However, this comes at the cost of sharing the host kernel across all workloads; a single kernel vulnerability can compromise every pod on the node.
2. Readiness latency (Kubernetes view)
In this experiment, we deploy 100 pods over each container runtime and
variants, but for Kata Containers we limit the pods to the max pods found in
the density experiment before. Then, we track pod readiness by polling the
Kubernetes API and counting pods that are both in the Running phase and have
the Ready=True condition.
From this, we derive when the first pod becomes Ready, when all pods become Ready and how pods become ready for each container runtime and variants.

Despite providing VM-level isolation, urunc matches or even outperforms runc in time-to-all-ready for several variants. This means that on edge hardware, strong isolation does not have to come at a startup penalty. gVisor and Kata Containers, on the other hand, pay a significant cost: their sandbox overhead stretches the total deployment time considerably, which matters when pods need to scale quickly in response to demand.

Up to around 20 pods, most runtimes behave similarly, There is enough headroom to absorb the per-pod overhead. Beyond that point, the cost of each additional sandbox accumulates and the runtimes diverge: urunc and runc continue scaling at a similar pace, while gVisor and Kata Firecracker slow down noticeably. Kata QEMU is the outlier, falling behind almost immediately due to its heavier VMM footprint.
3. HTTP availability latency
Nevertheless, a container in Ready and Running state does not necessarily mean
that it is responsive. For that reason, we also measure when pods become
reachable, probing blackbox exporter for probe_success over every pod IP.
From this experiment, we derive when the first pod is able to respond, when all pods are responding and the progression over time for each container runtime and variant.

The pattern mirrors the readiness results: urunc variants stay close to runc, with the Linux/QEMU combination showing the largest overhead among them. gVisor and Kata Containers are significantly slower. Kata QEMU appears faster than gVisor and Kata Firecracker here, but this is misleading, since it only had to bring up 21 pods, not 100, so its per-pod cost is masked by the smaller workload.

Due to the similar results with the readiness experiment and the interval of sampling at 0.5s, we can easily observe that the gap between a pod becoming Ready and actually responding to HTTP requests is consistently less than 0.5s across all runtimes. Capturing the exact sub-second difference would require a finer-grained probing mechanism.

The HTTP availability timeline closely tracks the readiness timeline with no runtime showing a significant additional delay between becoming Ready and serving traffic.

Comparing the best-performing variant per category makes the overall picture clear: all runtimes get their first pod responding at roughly the same time, but the tail, how long it takes for all replicas to become reachable, varies dramatically. This tail latency is extremely important in cases where partial availability is not enough.
Discussion and Conclusion
In this post we performed a small evaluation of multiple container runtimes on a Raspberry Pi 5, focusing on their behavior under resource constraints.
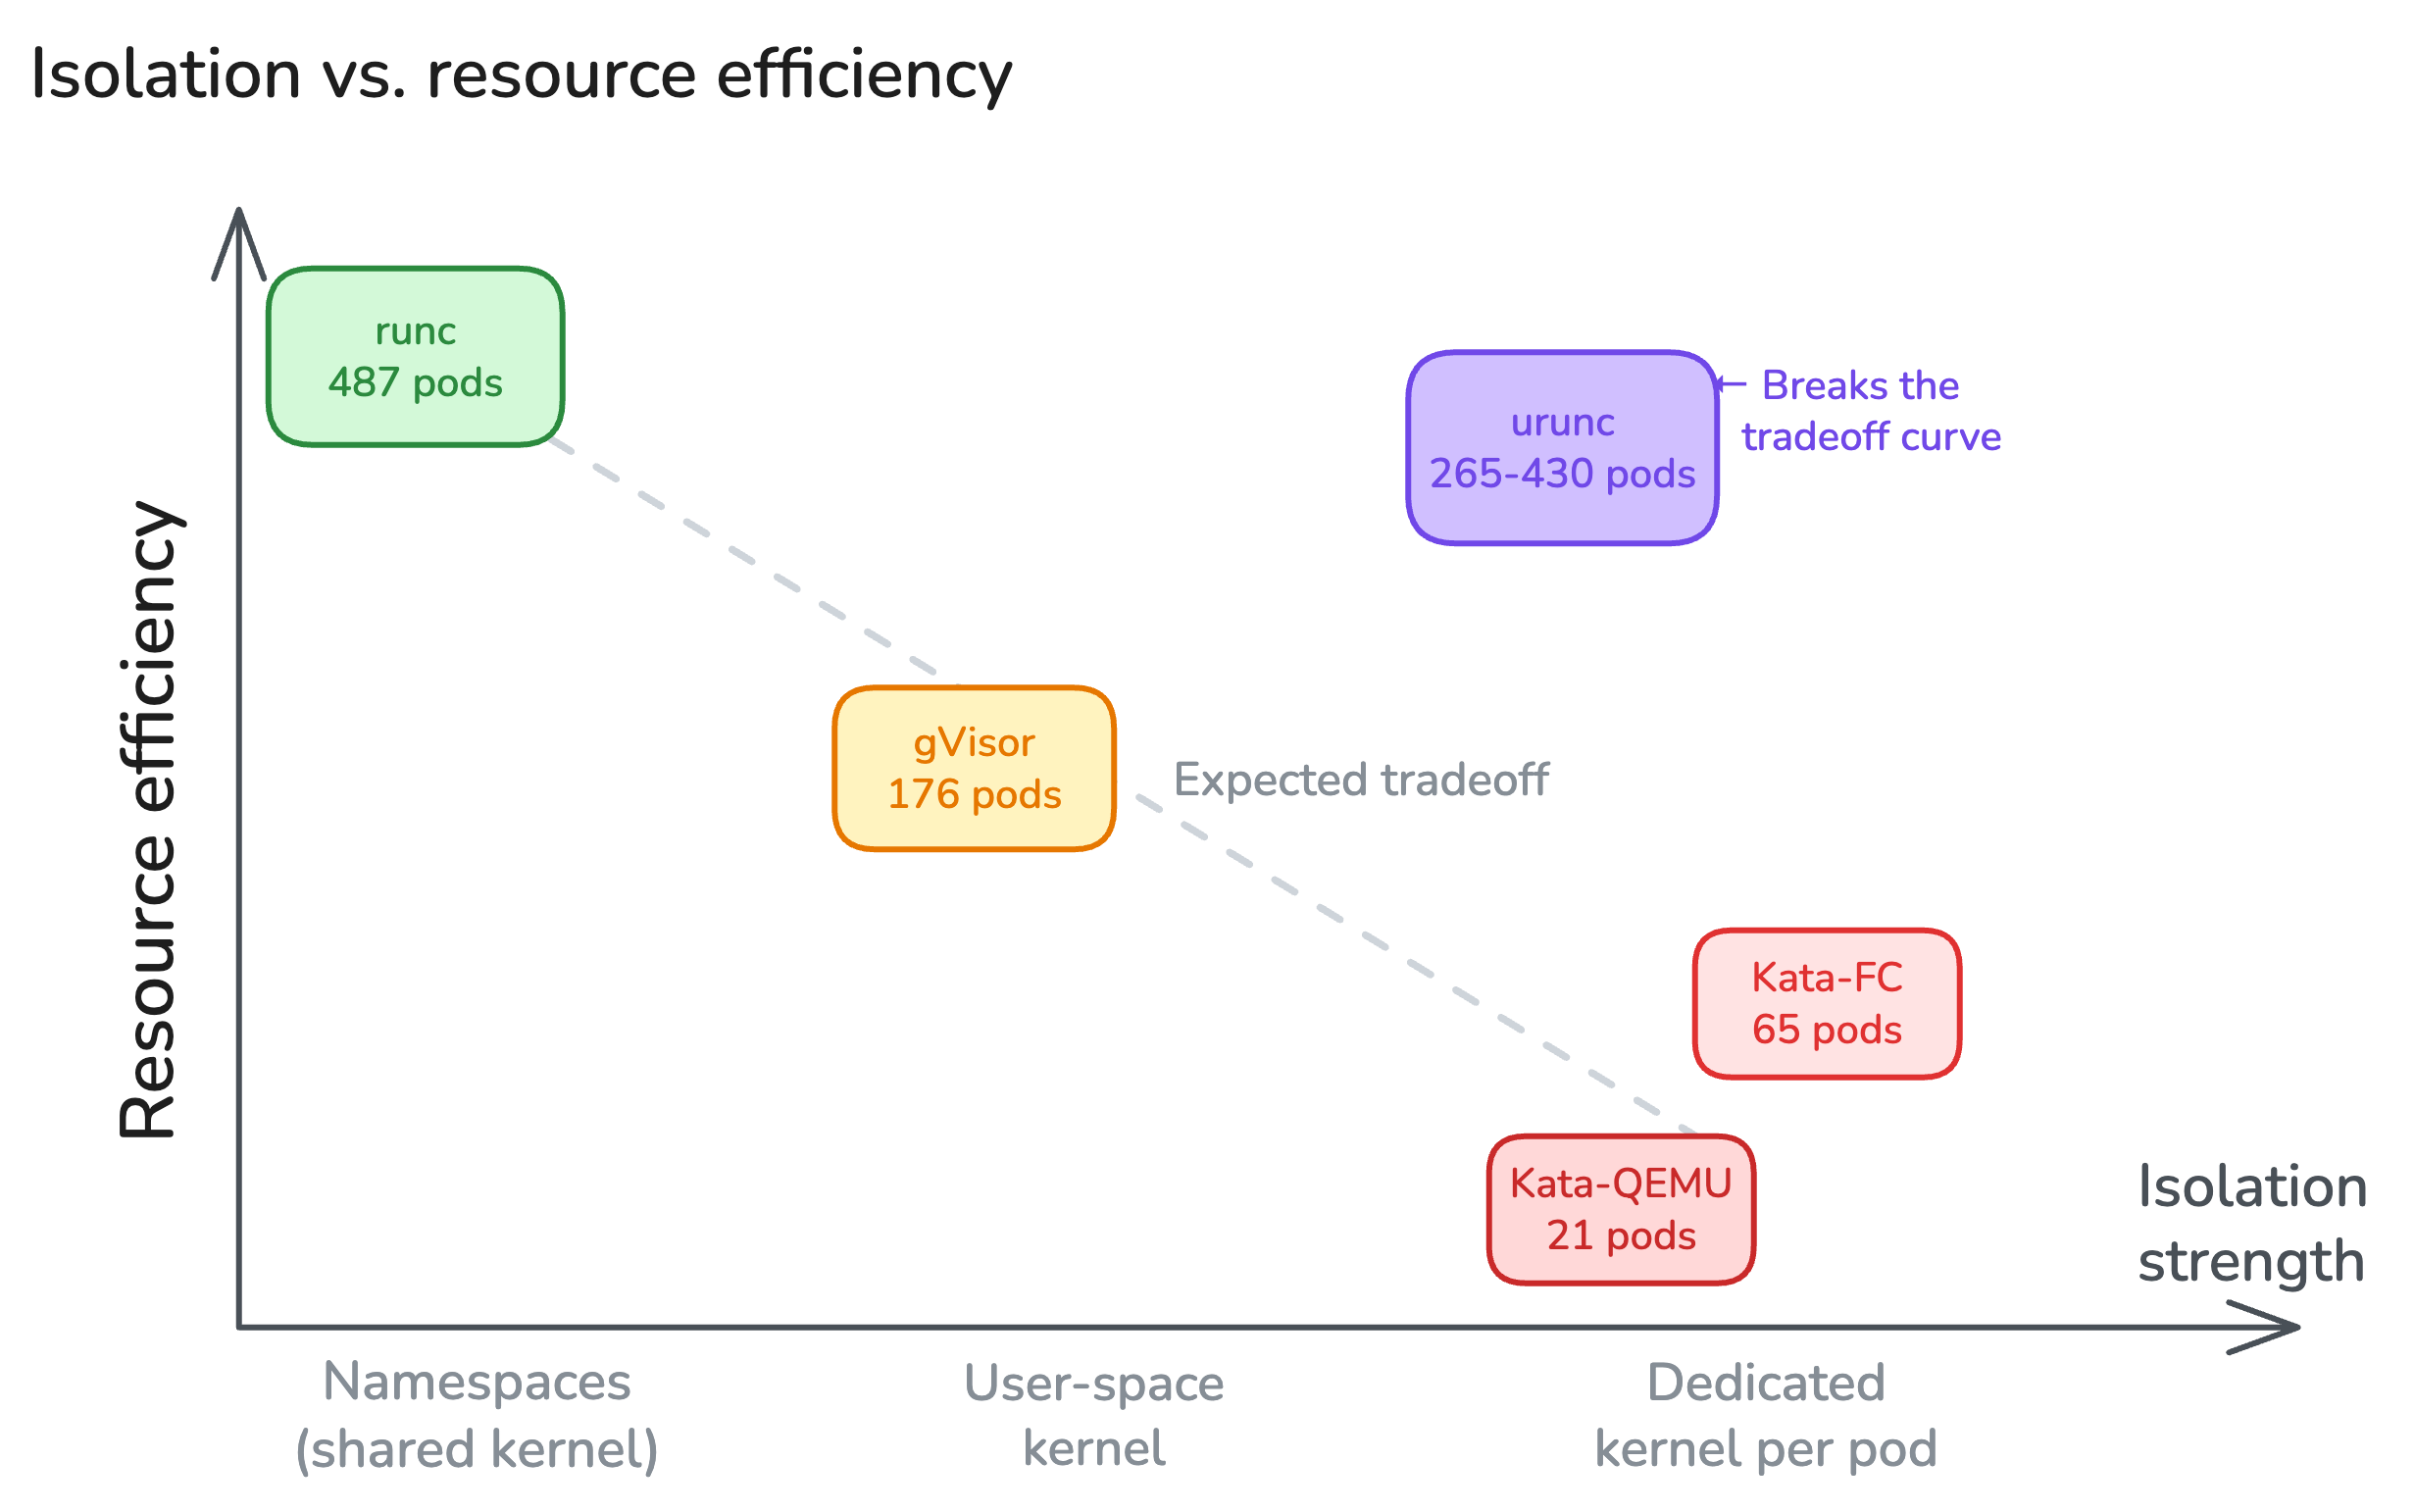
The conventional wisdom is that stronger isolation costs more resources. Our results confirm this for most runtimes: Kata Containers provide VM-level isolation but max out at 21–65 pods, gVisor offers a middle ground at 176 pods, and runc scales the furthest at 487+ pods but shares the host kernel across all workloads; meaning a single kernel vulnerability can compromise every pod on the node.
urunc breaks this tradeoff. By running unikernels or minimal single-application kernels directly inside lightweight VMMs, it minimizes the resource consumption of the additional isolation layers and reduces the overall overhead of the sandbox. The result: urunc achieves VM-level isolation, each container gets its own VM sandbox, while matching runc in startup latency and approaching it in pod density. Specifically, with unikernels, urunc scales to 265-430 pods depending on the variant; even with stripped-down generic kernels like Linux, it still reaches 165-210 pods, comparable to or better than gVisor, while retaining full VM-level isolation.
This matters for edge deployments where the choice between security and capacity has real consequences. With runc, operators accept kernel-sharing risk to fit more workloads. With Kata or gVisor, they pay a steep resource tax for isolation. urunc shows that this is a false dilemma: strong isolation and high density can coexist on the same resource-constrained hardware.
In short, strong isolation on resource-constrained edge hardware is not only feasible but, with the right runtime, comes at a surprisingly low cost.
The full setup, scripts, and source code used in this post are available at: https://github.com/nubificus/runtime-benchmarking-rpi5. We invite everyone to play around and reproduce the results.
Discuss this post on Hacker News.